Understanding pharmacy trend is important for developing robust, cost-saving specialty drug management strategies. But did you know you can’t really compare one trend number to another? Every PBM uses different methodologies, data sets, and calculations to arrive at their pharmacy trend number.
Additionally, one of the largest cost drivers of specialty spend today—prescriptions drugs dispensed through the medical benefit—is typically missing from pharmacy trend statistics. When you combine pharmacy benefit with medical benefit spend, you get what we like to call big ‘T’ Trend. In fact, you need to combine both to see there is as much, if not more, specialty spend going through the medical benefit today that is going unmanaged.
The ninth edition of the Magellan Rx Management Medical Pharmacy Trend Report includes a comprehensive medical pharmacy trend analysis and data benchmarking for provider-administered drugs which are infused or injected and paid under the medical benefit.
What are the top medical pharmacy trends you need to know to stay current with your organization’s management strategies?
- Per-member-per-month (PMPM) spend on provider-administered drugs increased by 18% for commercial members in one year, reaching nearly $30 PMPM. The five-year trend is 68% — the highest jump in 9 years of reporting.
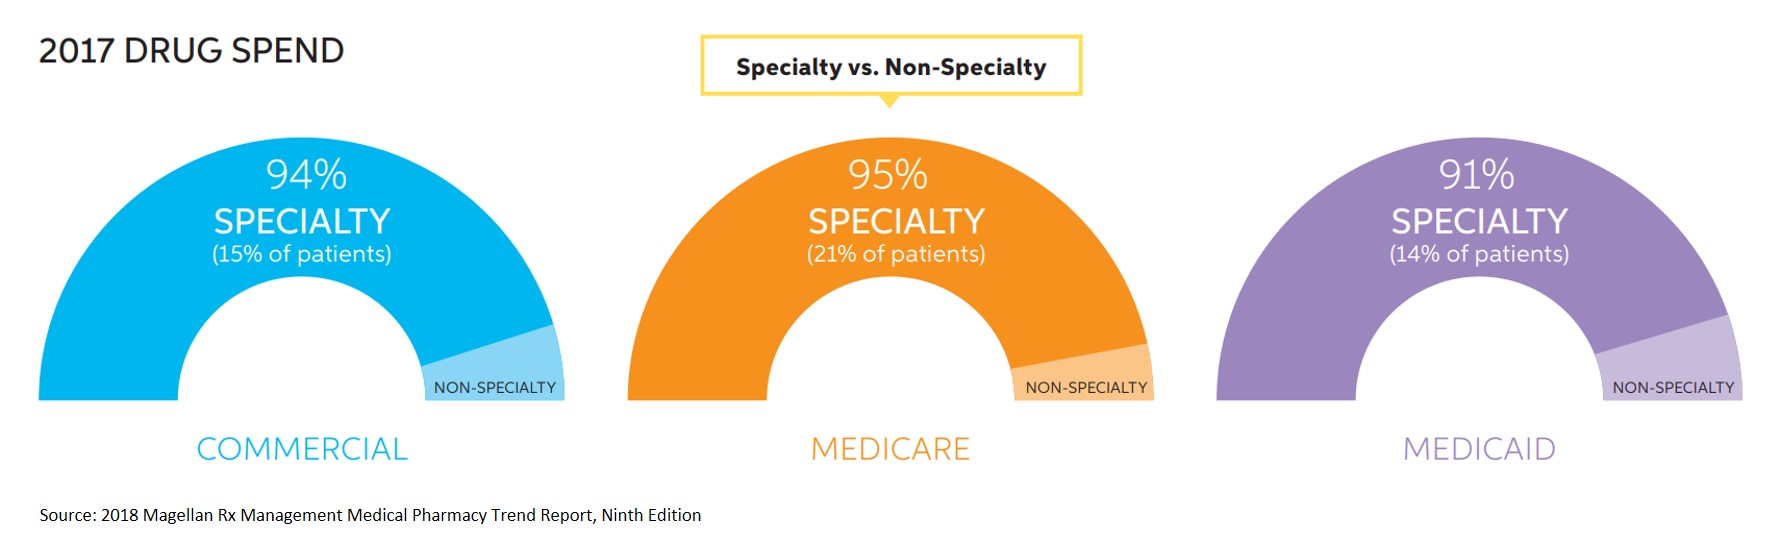
- Across all lines of business (LOB), more than 90% of total drug spend on the medical benefit is being driven by a fraction of members who are taking specialty medications.
- Emerging oncology treatments, particularly immunotherapy, are a major medical pharmacy trend driver. Keytruda had an impactful increase in utilization, with PMPM trend rising upwards of 200% and breaking into the top 15 drugs across all LOBs.
- In Medicare, oncology and oncology-support drugs accounted for 58% ($30.17) of the medical benefit drug PMPM spend.
- Chimeric antigen receptor (CAR) T cell gene therapies are predicted to grow 530% by the year 2022.
- Factor products to treat hemophilia demonstrated the highest trend in both commercial (62%) and Medicare (185%), ranking #5 and #6, respectively. The average cost per claim is close to $20,000 across both LOBs.
- Although 68% of payers are now using a site of service (SOS) program, SOS continues to be a concern with drugs administered in the hospital outpatient setting continuing to cost 2-3 times more than physician offices and home infusion.
- When it comes to biosimilars, 64% of payers stated that the price of the biosimilar most impacted reimbursement decisions.
- The top five drugs in commercial (Remicade, Neulasta, Rituxan, Herceptin, and Avastin) have remained consistent over the last nine years of reporting. However, all of these drugs have FDA-approved biosimilars that should all be available on the market in the next few months and, looking ahead, this landscape may look different over the next few years with this increased competition.
- The number of billion-dollar drugs in 2017 was 34 and is projected to grow 26% to 43 drugs by 2022. All 43 are currently available on the market today, representing increased utilization and growth of these products in the next five years and reinforcing the need for proper utilization management, targeted dosing optimization and other management tactics of these high cost medical specialty drugs which will help to promote quality of care and prudent savings of healthcare dollars.
For more in-depth analysis on the latest in medical pharmacy trend and spend, watch our on-demand webinar!


2 thoughts on “Top 10 Pharmacy Trends You Need to Know in 2019”